The source files can be found in user_guide/.
Choosing a strategy
The previous pages showed how to call each tool. This page helps you choose one. Four questions about your situation lead to a choice. The investor profiles work through four complete cases, and this page gives the questions behind them.
The four questions
1. How much compute can you spend on each rebalance?
Naive optimisers (InverseVolatility, EqualWeighted) need no solver and return at once. JuMP optimisers (MeanRisk, RiskBudgeting) solve a convex program, which takes longer than a naive rule. Meta-optimisers (NestedClustered, Stacking) and cross-validated tuning solve many programs and cost the most.
2. How often do you rebalance?
If you rebalance often, use cheap and stable rules, and bound the Turnover or charge the Fees, so that the trading costs do not cancel the excess return. If you rebalance rarely, you can spend more compute on each optimisation.
3. How much do you trust your estimates?
If you have forecasts, add them to the prior with a view prior (BlackLittermanPrior, EntropyPoolingPrior). If you do not trust the moments, make the optimisation robust with an uncertainty set on the covariance (UncertaintySetVariance) or on the expected returns. Or use the hierarchy of the correlations (HierarchicalRiskParity) in place of point estimates.
4. How large is your capital, and how many constraints does your mandate set?
A small account needs a finite allocation, such as GreedyAllocation, to buy whole shares and leave little cash. An institutional mandate has many constraints, such as weight bounds, group limits and tracking, and the JuMP optimisers take all of them.
A table of starting points
| Situation | Use |
|---|---|
| Little compute, and you want diversification | InverseVolatility or EqualWeighted |
| The trade-off between risk and return | MeanRisk with an objective, or its efficient frontier |
| Each asset carries the same share of the risk | RiskBudgeting |
| Tail losses or drawdowns matter more than the variance | set the r of MeanRisk to a tail measure (ConditionalValueatRisk) or a drawdown measure (MaximumDrawdown) |
| Many assets, and a covariance that changes | HierarchicalRiskParity or another clustering optimiser |
| You do not trust one fit | NestedClustered or Stacking, or an uncertainty set |
| You have views | BlackLittermanPrior or EntropyPoolingPrior |
| Trading costs matter | add Turnover or Fees to a JuMPOptimiser |
| You trade the portfolio | end with GreedyAllocation |
Most strategies combine several rows, such as a view prior, constraints and a finite allocation.
Three strategies on the same data
We run three strategies from the table on the same data: equal weights, the minimum-risk MeanRisk and HRP. We plot their weights. In the plot, the minimum-risk bar has few colours, and the HRP bar has one colour for every asset.
using PortfolioOptimisers, CSV, TimeSeries, Clarabel, StatsPlots, GraphRecipesX = TimeArray(CSV.File(joinpath(@__DIR__, "../examples/SP500.csv.gz")); timestamp = :Date)[(end - 252):end]rd = prices_to_returns(X)pr = prior(EmpiricalPrior(), rd)slv = Solver(; name = :clarabel, solver = Clarabel.Optimizer, settings = Dict("verbose" => false), check_sol = (; allow_local = true, allow_almost = true))res_ew = optimise(EqualWeighted(), rd)res_mr = optimise(MeanRisk(; obj = MinimumRisk(), opt = JuMPOptimiser(; pe = pr, slv = slv)))res_hrp = optimise(HierarchicalRiskParity(; r = Variance(), opt = HierarchicalOptimiser(; pe = pr, cle = clusterise(ClustersEstimator(), pr.X))))plot_stacked_bar_composition([res_ew, res_mr, res_hrp], rd; xticks = (1:3, ["EqualWeighted", "MinRisk", "HRP"]))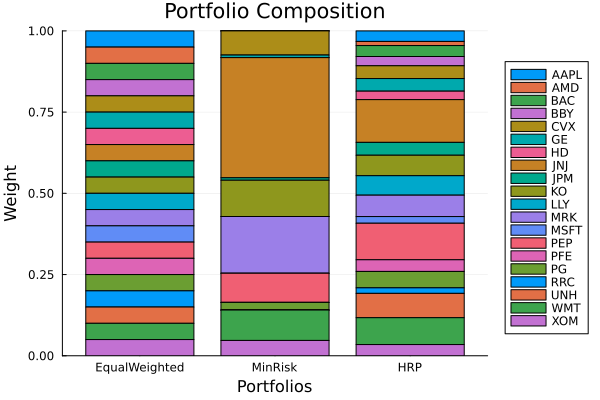
This page was generated using Literate.jl.