
The source files can be found in examples/.
Data preprocessing and imputation
Real price data is rarely clean. Assets list partway through the window (leading gaps), trade halts and stale quotes leave flat or missing stretches, names get delisted (trailing gaps), and exchanges keep different holiday calendars so timestamps do not line up. Feeding that straight into an optimiser is a recipe for silent errors. prices_to_returns handles all of it in one call, before it computes returns, through three cooperating controls:
missing_col_percent— drop any asset whose fraction of missing observations exceeds this threshold (too sparse to trust).missing_row_percent— drop any timestamp whose fraction of missing values across assets exceeds this threshold (e.g. a misaligned holiday).impute_method— fill the remaining gaps with anImputeimputor before differencing prices into returns.
The order matters: filter the hopeless rows/columns first, then impute what is left, then compute returns.
When to reach for this
Reach for these whenever the raw price table has missing values — newly listed or delisted assets, halted or stale prices, or non-overlapping trading calendars. The decision for each asset or date is drop or fill: drop what is too sparse to trust (missing_*_percent), fill what is recoverable (impute_method), and let prices_to_returns do both in one pass.
Impute.jl imputors
Imputation methods are Impute.jl imputors passed via impute_method, so bring in using Impute. The two most useful for prices are Impute.LOCF() (last observation carried forward — the right model for a halt or stale quote, since it holds the last traded price) and Impute.Interpolate() (linear interpolation — natural for short gaps between two good prices).
using PortfolioOptimisers, PrettyTables, DataFrames, Statistics, Impute

resfmt = (v, i, j) -> begin
    if j == 1
        return v
    else
        return isa(v, Number) ? "$(round(v * 100, digits = 3)) %" : v
    end
end;
1. A clean slice, then realistic damage
We start from the usual S&P 500 slice and deliberately injure it to mimic the messes above: one asset that is mostly missing (a late lister we will want to drop), a halted block of one asset, and scattered single-day gaps across the rest.
using CSV, TimeSeries

X = TimeArray(CSV.File(joinpath(@__DIR__, "..", "SP500.csv.gz")); timestamp = :Date)[(end - 252):end]
ts = timestamp(X)
nx = string.(colnames(X))
T, N = size(values(X))

vals = Matrix{Union{Float64, Missing}}(values(X))
vals[1:160, 3] .= missing                 # asset 3: mostly missing (late lister → drop)
vals[100:120, 2] .= missing               # asset 2: a ~3-week trading halt (fillable)
using StableRNGs
rng = StableRNG(42)
for _ in 1:60                              # scattered single-day gaps elsewhere
    vals[rand(rng, 1:T), rand(rng, 4:N)] = missing
end
Xmiss = TimeArray(ts, vals, Symbol.(nx))
253×20 TimeSeries.TimeArray{Union{Missing, Float64}, 2, Date, Matrix{Union{Missing, Float64}}} 2021-12-28 to 2022-12-28
┌────────────┬─────────┬────────┬─────────┬─────────┬─────────┬────────┬────────
│ │ AAPL │ AMD │ BAC │ BBY │ CVX │ GE │ HD ⋯
├────────────┼─────────┼────────┼─────────┼─────────┼─────────┼────────┼────────
│ 2021-12-28 │ 177.738 │ 153.15 │ missing │ 92.981 │ 112.335 │ 73.953 │ 390. ⋯
│ 2021-12-29 │ 177.827 │ 148.26 │ missing │ 94.233 │ 111.757 │ 73.557 │ 395.0 ⋯
│ 2021-12-30 │ 176.657 │ 145.15 │ missing │ 94.877 │ 111.264 │ 73.487 │ 394.1 ⋯
│ 2021-12-31 │ 176.033 │ 143.9 │ missing │ 94.924 │ 111.188 │ 73.309 │ 399.0 ⋯
│ 2022-01-03 │ 180.434 │ 150.24 │ missing │ 95.41 │ 112.998 │ 74.682 │ 392.9 ⋯
│ 2022-01-04 │ 178.144 │ 144.42 │ missing │ 98.231 │ 115.054 │ 77.111 │ 396.9 ⋯
│ 2022-01-05 │ 173.406 │ 136.15 │ missing │ 96.232 │ 115.803 │ 77.111 │ 391.5 ⋯
│ 2022-01-06 │ 170.511 │ 136.23 │ missing │ 96.12 │ 116.788 │ 77.561 │ 390.1 ⋯
│ ⋮ │ ⋮ │ ⋮ │ ⋮ │ ⋮ │ ⋮ │ ⋮ │ ⋮ ⋱
│ 2022-12-19 │ 131.986 │ 64.59 │ 31.601 │ missing │ 166.758 │ 60.835 │ 312.7 ⋯
│ 2022-12-20 │ 131.916 │ 65.05 │ 31.729 │ 77.371 │ 169.497 │ 62.604 │ 310.3 ⋯
│ 2022-12-21 │ 135.057 │ 67.68 │ 32.212 │ 78.729 │ 171.49 │ 64.67 │ 314.7 ⋯
│ 2022-12-22 │ 131.846 │ 63.86 │ 31.927 │ 78.563 │ 168.918 │ 63.727 │ 311.6 ⋯
│ 2022-12-23 │ 131.477 │ 64.52 │ 32.005 │ 79.432 │ 174.14 │ 63.742 │ 314.1 ⋯
│ 2022-12-27 │ 129.652 │ 63.27 │ 32.065 │ 79.93 │ 176.329 │ 64.561 │ 314.9 ⋯
│ 2022-12-28 │ 125.674 │ 62.57 │ 32.301 │ 78.279 │ 173.728 │ 63.883 │ 311. ⋯
└────────────┴─────────┴────────┴─────────┴─────────┴─────────┴────────┴────────
14 columns and 238 rows omitted2. Diagnose the missingness
Before deciding what to drop or fill, measure it. The per-column and per-row missing fractions are exactly the quantities missing_col_percent and missing_row_percent threshold against.
col_missing = vec(mean(ismissing, vals; dims = 1))
worst_cols = sort(DataFrame(; asset = nx, missing_frac = col_missing), :missing_frac;
                  rev = true)
pretty_table(first(worst_cols, 6); formatters = [resfmt],
             title = "Missing fraction per asset (worst six)")
Missing fraction per asset (worst six)
┌────────┬──────────────┐
│ asset │ missing_frac │
│ String │ Float64? │
├────────┼──────────────┤
│ BAC │ 63.241 % │
│ AMD │ 8.3 % │
│ JPM │ 5.138 % │
│ BBY │ 2.767 % │
│ LLY │ 2.372 % │
│ UNH │ 2.372 % │
└────────┴──────────────┘Asset 3 is missing ~64% of the time — there is no honest way to impute that, so it should be dropped. Asset 2's halt and the scattered single-day gaps, by contrast, are short and recoverable.
3. Drop the hopeless, keep the rest
missing_col_percent = 0.5 drops any asset more than half missing (asset 3), while missing_row_percent = 0.5 would drop any date more than half missing across assets. With no imputation yet, the kept assets still contain gaps, so we ask only how many assets survive the filter.
rd_droponly = prices_to_returns(Xmiss; missing_col_percent = 0.5, missing_row_percent = 0.5,
                                impute_method = Impute.LOCF())
println("Assets kept after the 50% column filter: $(length(rd_droponly.nx)) of $N")
Assets kept after the 50% column filter: 19 of 204. Impute the survivors
The kept assets still have a halt and scattered gaps. We fill them with two different imputors and compare. Impute.LOCF() carries the last observed price forward — so a halt becomes a flat price stretch and therefore zero returns through the halt, which is the honest accounting for a non-trading period. Impute.Interpolate() draws a straight line across the gap, spreading a small constant return over the missing days.
rd_locf = prices_to_returns(Xmiss; missing_col_percent = 0.5, impute_method = Impute.LOCF())
rd_interp = prices_to_returns(Xmiss; missing_col_percent = 0.5,
                              impute_method = Impute.Interpolate())

pretty_table(DataFrame(; method = ["LOCF", "Interpolate"],
                       assets = [length(rd_locf.nx), length(rd_interp.nx)],
                       observations = [size(rd_locf.X, 1), size(rd_interp.X, 1)]);
             title = "Both imputors yield a complete returns matrix")
Both imputors yield a complete returns matrix
┌─────────────┬────────┬──────────────┐
│ method │ assets │ observations │
│ String │ Int64 │ Int64 │
├─────────────┼────────┼──────────────┤
│ LOCF │ 20 │ 92 │
│ Interpolate │ 20 │ 92 │
└─────────────┴────────┴──────────────┘5. Straight into the pipeline
A cleaned ReturnsResult is just an ordinary one — it flows into the rest of the package with no special handling. We solve a minimum-variance MeanRisk on the LOCF-imputed data to confirm the preprocessing produced something usable end to end.
using Clarabel
slv = Solver(; name = :clarabel, solver = Clarabel.Optimizer,
             settings = Dict("verbose" => false),
             check_sol = (; allow_local = true, allow_almost = true))
res = optimise(MeanRisk(; obj = MinimumRisk(),
                        opt = JuMPOptimiser(; pe = prior(EmpiricalPrior(), rd_locf),
                                            slv = slv)))
println("Min-variance solve on cleaned data: $(res.retcode), $(count(>(1e-6), res.w)) active names")
Min-variance solve on cleaned data: OptimisationSuccess
res ┴ Dict{Any, Any}: Dict{Any, Any}()
, 8 active names6. Visualising the damage
A heatmap of the missingness mask makes the structure obvious: the wide band is asset 3 (dropped by the column filter), the short block is asset 2's halt, and the speckle is the scattered gaps that imputation fills.
using StatsPlots, GraphRecipes
heatmap(1:N, 1:T, Float64.(ismissing.(vals)); xlabel = "Asset", ylabel = "Day",
        colorbar_title = "missing", title = "Missingness pattern (raw data)", yflip = true)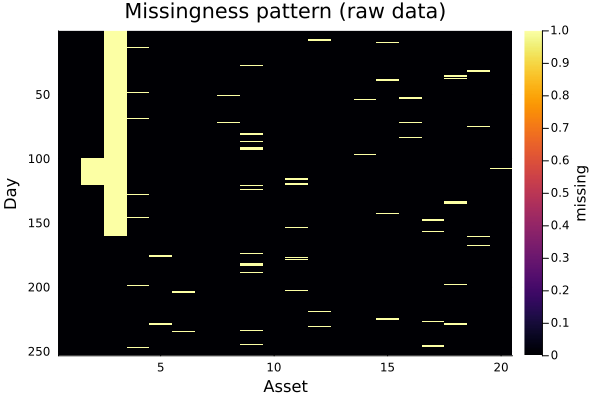
Summary
prices_to_returns is the single entry point for cleaning price data:
missing_col_percent/missing_row_percentdrop assets and dates that are too sparse to trust, before any returns are computed.impute_methodfills the recoverable gaps with anImpute.jlimputor —Impute.LOCF()for halts and stale quotes,Impute.Interpolate()for short gaps.The result is an ordinary
ReturnsResultthat feeds the rest of the pipeline unchanged.
This page was generated using Literate.jl.