The source files can be found in examples/.
Benchmark tracker
A benchmark tracker is a portfolio whose returns follow the returns of an index as closely as possible. Its objective is the tracking error, the distance between the two series of returns. A fund that tracks an index often holds only a part of the index, because each position costs money to hold and to trade, so the tracker also has a cap on the number of assets.
The library states this problem with parts that already exist:
TrackingRiskMeasurewith aReturnsTrackingbenchmark measures the tracking error to a series of returns, such as an index;MinimumRiskmakes that measure the objective ofMeanRisk;- the
cardkeyword ofJuMPOptimisercaps the number of assets that hold a weight.
The turnover and tracking example shows the tracking measures, and the cardinality and threshold example shows card. This page puts them together, and shows how the tracking error grows as the cap falls.
Reach for a benchmark tracker when your mandate is to follow an index, and you cannot or do not want to hold every asset of the index. To beat the index within a limit instead, put the tracking error in a constraint, as section 5 of the turnover and tracking example does.
card adds binary variables, so the capped trackers need a mixed-integer solver.
using PortfolioOptimisers, CSV, TimeSeries, DataFrames, PrettyTables, HiGHS, JuMP, StatsPlotsresfmt = (v, i, j) -> begin if j == 1 return v else return isa(v, AbstractFloat) ? "$(round(v * 100, digits = 3)) %" : v endend;1. Data, the index and the solvers
The data is one year of S&P 500 prices of 20 assets. The index is the S&P 500 index, and we take its returns over the same days.
X = TimeArray(CSV.File(joinpath(@__DIR__, "..", "SP500.csv.gz")); timestamp = :Date)[(end - 252):end]rd = prices_to_returns(X)pr = prior(EmpiricalPrior(), rd)N = length(rd.nx)idx = TimeArray(CSV.File(joinpath(@__DIR__, "..", "SP500_idx.csv.gz")); timestamp = :Date)index_returns = vec(values(percentchange(idx)))[(end - 251):end]252-element Vector{Float64}:
0.0014018951394268839
-0.0029897555945101162
-0.0026261799136566293
0.00637405253096993
-0.0006296219570611683
-0.019392757790686953
-0.0009637690162073926
-0.0040502167400909145
-0.0014410312534553708
0.009159984668711088
0.002817754443029298
-0.014243615286429718
0.0008199802697487364
-0.018387945694007184
-0.00968954186833869
-0.011037378494149845
-0.01891482186790842
0.002771738943382872
-0.012171906253647174
-0.001496635847752229
-0.005384088757710064
0.024347646888075024
0.018885951732779634
0.006863003557802621
0.009422515447335222
-0.024391082077443296
0.005156929864422621
-0.003701712634742571
0.008401207191662893
0.01451720788750584
-0.018115725668459964
-0.018969454344562455
-0.0038405967262939316
0.015766721170720453
0.0008812077558944621
-0.021173138152194876
-0.0071661613961421615
-0.010142945264833073
-0.01841212284548692
0.014956856067329447
0.022372677655602975
-0.0024426034406486727
-0.0154735036804102
0.018642691757319182
-0.005254666430087777
-0.007934042550334851
-0.029518158313447822
-0.007233753518199912
0.025698247891435034
-0.004291813651668034
-0.012961545123475388
-0.007421002465963727
0.021408574170872198
0.022383761357181644
0.012347817571452691
0.011662294827948477
-0.0004346603621044734
0.01130411360065013
-0.012272698789158725
0.014343912920567154
0.005066170567447729
0.007144955276587445
0.012256547427531394
-0.006293700174699054
-0.015652540713177183
0.0034102225843581466
0.008090938687879802
-0.012551720801808197
-0.009716916613270246
0.004253385628491824
-0.0026510264820544293
-0.01687729010355377
-0.0034174477177431207
0.011174577597236304
-0.012144137844397704
-0.00020486828403339785
0.016057604355527832
-0.0006184750715813052
-0.014752948498371499
-0.027740054250754473
0.005697936985382991
-0.0281463084310036
0.0020980468517019252
0.024746900072939594
-0.03628450710641499
0.00567524281235347
0.0048371263814867066
0.029862421084403457
-0.035649708609807616
-0.005674224842483906
-0.03203710063235621
0.0024578974498530855
-0.016463207503938294
-0.001295964505871553
0.023869695423070582
-0.003946400929555649
0.0201696322348631
-0.040395260787451204
-0.005833781800993746
0.00014614176965959387
0.0185550399309224
-0.008120797617174004
0.009450764734207815
0.019883256167223255
0.02474226295510932
-0.006274368617658629
-0.007482768681131215
0.01843101803848605
-0.016347313992416176
0.003137400778913677
0.009523393173234246
-0.010793945785934752
-0.023798693976354098
-0.029110303335524595
-0.03876843066523758
-0.0037736797459954827
0.014592504858983422
-0.03251195148816316
0.0022008656982533824
0.024477242280088164
-0.0013015723144016126
0.009532217409178489
0.030563293585835313
-0.0029730715337758095
-0.02014303607589267
-0.0007117454091586407
-0.008759278267999415
0.010553814029048857
0.0015841285142359387
0.0035731642904295903
0.014964587965242117
-0.0008302715298193023
-0.011527461422777111
-0.00924387871732169
-0.004456902512209155
-0.002998633902153331
0.01920124935943677
-0.008363571580831458
0.027628291645959282
0.005895806193263963
0.009861372709197392
-0.0093324669763461
0.0013151670479691362
-0.011543202662059042
0.026156273782937292
0.012133338697180123
0.014207760082582784
-0.0028230841271970424
-0.006662395550705855
0.015638477163140495
-0.0007773401640565139
-0.0016257460597341533
-0.0012375507238545067
-0.004248692893594649
0.02129063764129061
-0.0007054739583505391
0.01732236877456654
0.003969541899852816
0.0018756797165802323
-0.007237794954093695
0.0022695611701916453
-0.01290000113984814
-0.021400064919716032
-0.002237862677713212
0.002916160446300145
0.014091605518062234
-0.03368805871951862
-0.006666355799503962
-0.011028155571446803
-0.007817025105972326
0.0029962320243371535
-0.010736500458080708
-0.004095056983835971
0.018341016392734496
0.006610721877454888
0.015271449816333835
0.010584272769350473
-0.043236613400617185
0.003387012085324553
-0.011317739184354357
-0.00718213408944831
0.006857100716285752
-0.011272103097360335
-0.01711649360078574
-0.008427580979689521
-0.017232619015460145
-0.010340526208282574
-0.00212035980924215
0.01967213992623549
-0.02112643788023957
-0.01506669577198312
0.025883894952575336
0.030583700679552274
-0.0020179487570851093
-0.010245080846639663
-0.028003617786773613
-0.007492463633902337
-0.006519175777754569
-0.003290773148014144
0.02596564246086537
-0.023662663615654722
0.0264800523021711
0.011427569666488632
-0.006672097293451407
-0.007950909706563748
0.023724819822265004
0.011881976654620166
0.01626665457966845
-0.007387716072363058
-0.006082610618211261
0.024626377895926713
-0.007454404107657684
-0.004101230608784012
-0.025001984857343038
-0.010585992315429867
0.013618724670069545
0.0096139819205608
0.0055978928024623216
-0.020777886954788834
0.05543448436034406
0.009240746788148969
-0.00893577704880089
0.008713116550318485
-0.008252046497990032
-0.0030893228355322413
0.004758581908814978
-0.0038836886983300467
0.01357998792752726
0.005914689147846459
-0.0002830441976330235
-0.015444192913123912
-0.001591865337775247
0.03094787239738949
-0.0008676332180493552
-0.0011946604880664342
-0.01789421228356412
-0.014399194981406436
-0.0018623708845499226
0.007521781957503869
-0.007349578247902887
0.014279296218109248
0.007289664438793013
-0.006052724634100676
-0.024921675023713355
-0.011137750774081114
-0.00900751600185218
0.0010373383615335586
0.014867993802736032
-0.014451699568617239
0.0058681025252821884
-0.0040496221104088246
-0.0120206383226154732. The tracking error and the solver
TrackingRiskMeasure with a ReturnsTracking benchmark measures the distance between the returns of the portfolio and the returns of the index. Its alg field sets the norm of the daily differences. We use L1Norm, so the tracking error is the mean absolute difference between the daily return of the portfolio and the daily return of the index. It is in the units of a daily return.
With L1Norm, the tracker is a linear program, and the tracker with a cap is a mixed-integer linear program. HiGHS solves both.
tr = TrackingRiskMeasure(; tr = ReturnsTracking(; w = index_returns), alg = L1Norm())te(w) = expected_risk(tr, w, pr)slv = Solver(; name = :highs, solver = optimizer_with_attributes(HiGHS.Optimizer, JuMP.MOI.Silent() => true), check_sol = (; allow_local = true, allow_almost = true))Solver
name ┼ Symbol: :highs
solver ┼ MathOptInterface.OptimizerWithAttributes: MathOptInterface.OptimizerWithAttributes(HiGHS.Optimizer, Pair{MathOptInterface.AbstractOptimizerAttribute, Any}[MathOptInterface.Silent() => true])
settings ┼ nothing
check_sol ┼ @NamedTuple{allow_local::Bool, allow_almost::Bool}: (allow_local = true, allow_almost = true)
add_bridges ┴ Bool: true
The default norm, L2Norm, is the Euclidean norm of the daily differences divided by $\sqrt{T - 1}$, where $T$ is the number of days. It makes the capped tracker a mixed-integer conic problem, which needs a solver such as Pajarito, as in the cardinality and threshold example. On this data, one solve with card = 5 took 164 s with Pajarito. The same solve with L1Norm took 5 s with HiGHS, and the two portfolios had almost the same L2Norm tracking error.
3. The tracker without a cap
We minimise the tracking error with no cap, and compare it with the tracking error of the equal-weighted portfolio.
res_full = optimise(MeanRisk(; r = tr, obj = MinimumRisk(), opt = JuMPOptimiser(; pe = pr, slv = slv)))equal_weight = fill(1 / N, N)(te(res_full.w), te(equal_weight), count(>(1e-6), res_full.w))(0.002067098159728713, 0.004359397953099198, 20)4. A cap on the number of assets
card caps the number of assets that hold a weight. We solve the tracker for four caps.
cards = [3, 5, 8, 12]res_card = [optimise(MeanRisk(; r = tr, obj = MinimumRisk(), opt = JuMPOptimiser(; pe = pr, slv = slv, card = k))) for k in cards]pretty_table(DataFrame(; :cap => [string.(cards); "none"; "equal weighted"], Symbol("assets held") => [[count(>(1e-6), res.w) for res in res_card]; count(>(1e-6), res_full.w); N], Symbol("tracking error") => [te.(getproperty.(res_card, :w)); te(res_full.w); te(equal_weight)]); formatters = [resfmt], title = "Tracking error to the S&P 500 index by the cap on the number of assets")Tracking error to the S&P 500 index by the cap on the number of assets
┌────────────────┬─────────────┬────────────────┐
│ cap │ assets held │ tracking error │
│ String │ Int64 │ Float64 │
├────────────────┼─────────────┼────────────────┤
│ 3 │ 3 │ 0.399 % │
│ 5 │ 5 │ 0.305 % │
│ 8 │ 8 │ 0.239 % │
│ 12 │ 12 │ 0.212 % │
│ none │ 20 │ 0.207 % │
│ equal weighted │ 20 │ 0.436 % │
└────────────────┴─────────────┴────────────────┘Each tracker holds no more assets than its cap, and each one has a smaller tracking error than the equal-weighted portfolio of all 20 assets.
all(count(>(1e-6), res.w) <= k && te(res.w) < te(equal_weight) for (res, k) in zip(res_card, cards))trueA smaller cap gives the optimiser fewer choices, so the tracking error does not get smaller when the cap gets smaller.
issorted(te.(getproperty.(res_card, :w)); rev = true)true5. The tracker against the index
The plot shows the cumulative returns of the index, of the tracker with the cap of five assets, and of the equal-weighted portfolio.
cumret(x) = cumprod(1 .+ x) .- 1plot(rd.ts, cumret(index_returns); label = "S&P 500 index", ylabel = "Cumulative return", title = "Tracker and index")plot!(rd.ts, cumret(rd.X * res_card[2].w); label = "tracker, cap of 5")plot!(rd.ts, cumret(rd.X * equal_weight); label = "equal weighted")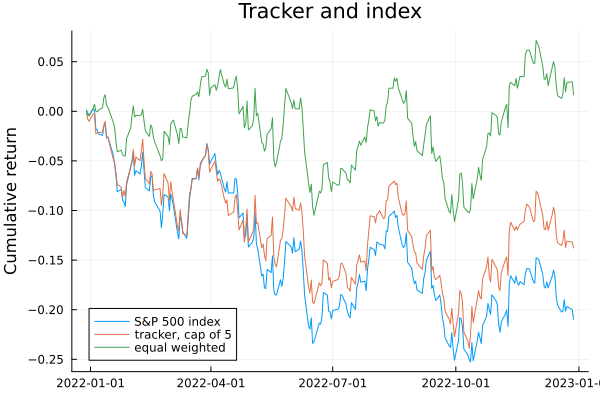
6. The compositions
The stacked bars show the weights of the trackers.
plot_stacked_bar_composition([res_card; res_full], rd; xticks = (1:(length(cards) + 1), [string.("cap ", cards); "no cap"]))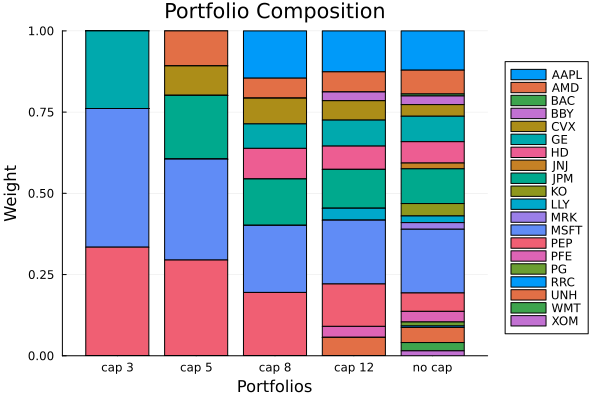
This page was generated using Literate.jl.